Water Quality Monitoring
Want to understand water quality in Lake James and our Watershed post Helene?
Watch this 20 minute video - The February 17, 2026 Lake James Watershed Symposium presentation by EQI's Ann Marie Traylor
Click here For more information on the additional testing Lake James Environmental Association completed post-Helene.
Monthly Water Quality Monitoring
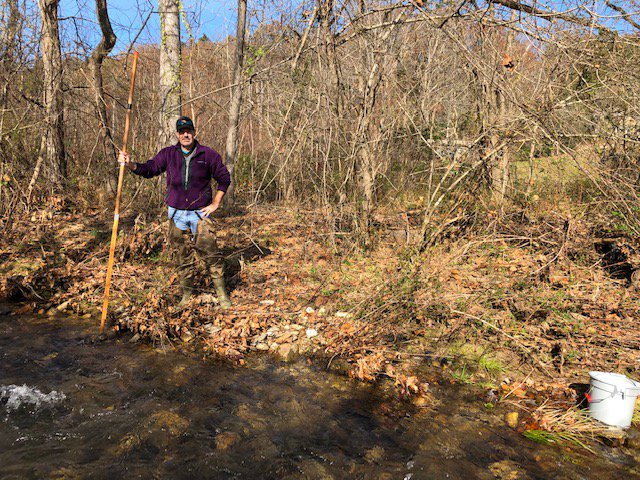
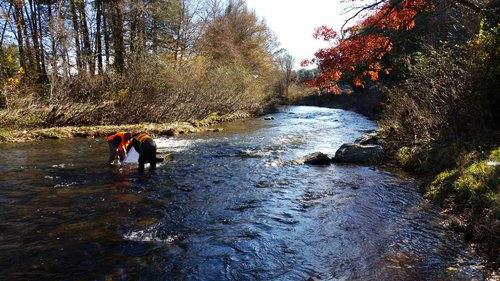
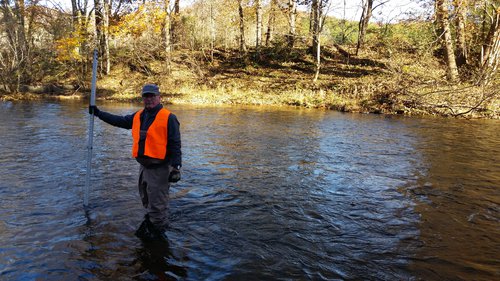
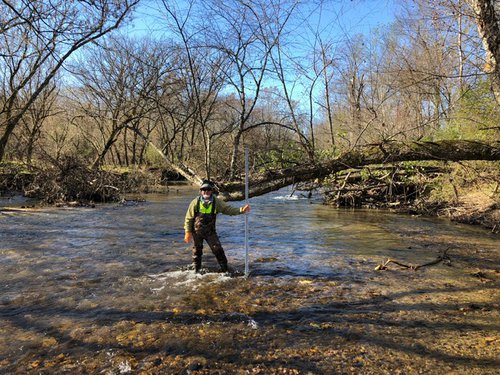
An important element in assessing the overall health of a watershed is to analyze the chemical characteristics of the water. The chemical makeup of the water, and therefore its quality, affects aquatic life, human health, and the economy, among other things. Consequently, water quality and monitoring is a major focus of Lake James Environmental Association.
On a monthly basis, LJEA volunteers sample water quality in twelve selected stream sites and six lake sites (see map above), and we work with the Environmental Quality Institute’s Volunteer Water Information Network (VWIN) program and our University Partners to evaluate those samples. In 2025, LJEA will spend over $19,000 in water quality laboratory fees. In addition, our water quality sampling volunteers will donate hundreds of hours and over 3500 miles of automobile and boat travel to collect samples and deliver them to the laboratories.In our collection of samples, we evaluate the following elements of water quality - click on each to understand why we evaluate them.
Check out our new Water Quality Dashboard
Orthophosphate is the dissolved phosphorus in water that is readily available for consumption by plants and algae. Phosphorous is a limiting nutrient for plant life in a water system. This restricts the growth and spread of aquatic plants and algae to within normal levels. If too much phosphorus becomes available to plants in the form of orthophosphate, it can be consumed immediately, leading to rapid and unrestricted growth. This can lead to abnormally high rates of algal growth, which result in periodic algal blooms in reservoirs and lakes. The overabundance of nutrients resulting in blooms is called eutrophication. Some sources of phosphorus include disturbed land, wastewater treatment plants, failing septic systems, runoff from fertilized crops and lawns, and livestock waste storage areas. There is no legal water quality standard, but phosphorus levels are ideal below 0.05 mg/L. Orthophosphate levels are considered ideal below 0.15 mg/L to prevent eutrophication. The VWIN regional average for orthophosphate is 0.10 mg/L, and the pristine (heavily forested) average is 0.04 mg/L.
Learn more about Orthophosphates from Agya
Orthophosphates_site.html (Click here to download our interactive graph)
Or Filter on Catawba River Basin in EQI'S Water Quality Data Portal Here
Nitrogen is another nutrient that can contribute to excessive stream and lake algal growth. High concentrations of Nitrogen in the form of nitrate is extremely toxic to infants and the unborn when ingested. It can prevent oxygen transfer in the blood stream at high doses. This is why the national drinking water standard is less than 10 mg/L. The most likely sources for higher nitrate levels in water are septic drainage and fertilizer runoff from agricultural land and domestic lawns. Nitrates from land sources wind up in streams more rapidly than other nutrients such as phosphorus because they are easily dissolved in water, and can therefore readily travel with surface runoff and groundwater into streams. As a result, nitrates are a useful indicator of sources of pollution from animal waste and/or sewage during dry weather. The VWIN regional average for nitrate/nitrite nitrogen is 0.4 mg/L, and the pristine average is 0.2 mg/L.
Nitrate_Nitrite_site.html (Click here to download our interactive graph)
Or Filter on Catawba River Basin in EQI'S Water Quality Data Portal Here
This form of nitrogen is created by the decomposition of dead plants and animals. Elevated levels of ammonia can be toxic to fish and other aquatic life. Likely sources of ammonia nitrogen are agricultural runoff, livestock farming, septic drainage, and discharge from sewage treatment plants. Streams with extensive trout farming may also show increased levels of ammonia due to the decomposition of fish waste. The proposed standard to protect trout waters is 1.0 mg/L in the summer and 2.0 mg/L in the winter. The VWIN regional average is 0.08 mg/L, and the pristine average is 0.04 mg/L.
Ammonia-Nitrogen_site.html (Click here to download our interactive graph)
Or Filter on Catawba River Basin in EQI'S Water Quality Data Portal Here
Conductivity is a measure of the ability of water to conduct an electrical current. Pure water will not conduct an electrical current, but water containing dissolved solids and salts will form charged ions that are conductive. The concentration of these ions in water determine its conductivity. These ions may include dissolved solids such as nitrate, phosphate, sodium, iron, and others. Streams, like many in the Lake James watershed, whose beds are composed of bedrock, particularly granitic bedrock, and coarse gravel have naturally low levels of conductivity. Conductivity is measured in micromhos per centimeter (μmhos/cm). The VWIN regional average is 72.1 μmhos/cm, and the pristine average is 18.7 μmhos/cm. Higher levels of conductivity could be an indicator of pollutants making their way into our streams.
Learn more about Conductivity from Agya
Conductivity_site.html (Click here to download our interactive graph)
Or Filter on Catawba River Basin in EQI'S Water Quality Data Portal Here

Acidity in a solution, such as water, is measured by using the 14 digit pH scale. (See Figure below for a graphic illustration of the scale)
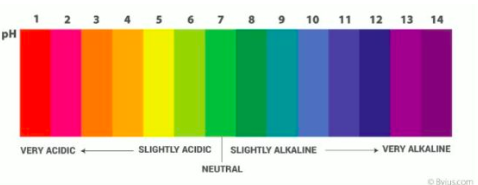
The naturally occurring pH in local streams should range between 6.5 – 7.2. Values less than 6.5 may suggest some source of acid influencing the pH of the stream. An example of an acidic source is acid rain, in which the water of the raindrops have an acidic (less than 7) pH. As the rain flows into the the streams, it affects the overall pH level of the water. The same is true with anything affecting the pH of the water towards the alkaline side of the pH scale. Any value above 7.5 may be due to industrial discharge. The VWIN regional average for pH is 7.1 with the pristine average being 6.9.
These pH values are important because organisms living in our streams and lakes have adapted to the naturally occurring pH level associated with their habitat. Any changes to the pH, even small fluctuations, whether acidic or alkaline, can highly impact the reproductive habits of these organisms and even eliminate them altogether. Therefore, pH is an important indicator of water quality because it can seriously impact and impair the aquatic ecosystem. It also plays an important role in controlling the solubility of certain toxic contaminants, such as metals in the water system.
Learn more about Acidity (PH) from Agya
pH_site.html (Click here to download our interactive graph)
Or Filter on Catawba River Basin in EQI'S Water Quality Data Portal Here
Alkalinity is used as a measurement to determine the acid neutralizing capability of water or soil. Water systems with a high alkalinity measurement are considered to be well buffered against acidic inputs into the system. Water bodies that are supplied with this buffer are able to neutralize any sources of acidic inputs, such as acid rain, decomposing organic matter, and industrial discharge. This alkaline buffer is often naturally occurring in a stream due to water runoff that has obtained a more alkaline pH from leaching across basic limestone soils or bedrock before flowing into the stream. A positive outcome of this leaching is that the pH levels in a water source are held relatively constant despite acidic inputs into the system. However, excessive acidic input can overwhelm the alkaline buffer, resulting in the previously mentioned acidic pH changes to the stream. We can anticipate acidification issues in our streams by measuring the associated alkalinity. Although there is no legal standard for alkalinity in water, measurements below 30 mg/L are considered low alkalinity. Streams in our region tend to have very low alkalinity due to the thinner soils, and because the underlying granitic bedrock does not contain many acid-neutralizing compounds. The VWIN regional average is 22.4 mg/L, and the pristine average is 8.4 mg/L.
Alk_site.html (Click here to download our interactive graph)
Or Filter on Catawba River Basin in EQI'S Water Quality Data Portal Here

Chlorophyll allows plants (including algae) to photosynthesize, i.e., use sunlight to convert simple molecules into organic compounds. Chlorophyll a is the primary type of chlorophyll found in green plants and algae.
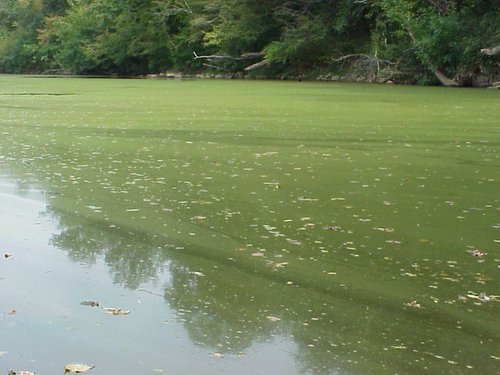
Chlorophyll a is used as a measure of the amount of algae growing in our lakes and streams and it is used by environmental agencies to classify the trophic condition of a waterbody. Although algae are a natural part of our streams, rivers, and lakes, too much algae can cause aesthetic problems such as green scums and bad odors, and can result in decreased levels of dissolved oxygen, which can be detrimental to other aquatic life. Some algae also produce toxins that can be of public health concern when they are found in high concentrations.
One of the symptoms of degraded water quality is the increase of algae as measured by the concentration of Chlorophyll a. Waters with high levels of nutrients from fertilizers, septic systems, sewage treatment plants and urban runoff may have high concentrations of Chlorophyll a and excess amounts of algae (https://www.epa.gov/national-aquatic-resource-surveys/indicators-chlorophyll).
Typically, levels of Chlorophyll a at 40 micrograms per liter would be in found in a lake approaching a hypereutrophic state. Lake James is classified as Mesotrophic(on the low end) so we would expect to see Chlorophyll a levels in some cases below 5 micrograms per liter with a few samples about the 5 micrograms per liter mark . To learn more about Lake James’ trophic classification click here.
Lake James Chlorophyll.pdf (see our results here)
Watch this video (27 Minutes) Dr. Mark Brenner of Warren Wilson College and a LJEA Board member presents an overview of Algae and Nutrients in the Lake James Watershed.
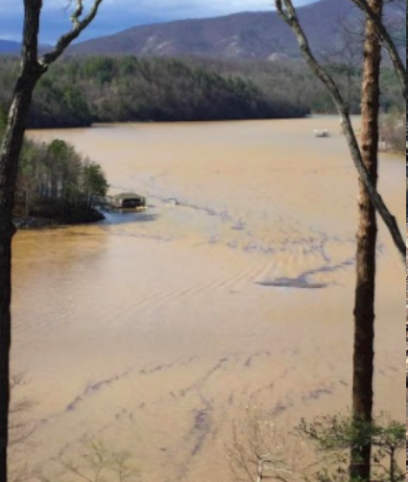
River and Lake Sediment and Turbidity Monitoring in the Lake James Watershed
LJEA volunteers, in cooperation with the Volunteer Water Information Network (VWIN) and the Environmental Quality Institute (EQI), have been monitoring the sediment and turbidity in the Catawba River, North Fork Catawba River, Linville River, and Lake James since 2002. Samples are taken monthly and laboratory analysis is used to quantify the Total Suspended Solids (TSS) and the Turbidity of each sample. The samples are taken at one location on each of the major rivers (Catawba River, North Fork Catawba River, Linville River).
Learn more about Turbidity from Agya
Turb_site.html (Click here to download our interactive graph)
tss_site.html (Click here to download our interactive graph)
Dissolved Oxygen (DO) is a measure of the free oxygen available in water. DO is essential to aquatic life including fish, invertebrates, bacteria and plants. A great explanation of DO and why it is important can be found here. LJEA volunteers collect measures at our six lake sampling sites between the months of May and September to look for indicators of major changes that could be having an adverse impact on our aquatic life.
See our Dissolved Oxygen data here (choose DO/Temp/Secchi tab)

Why test for E. coli?
Recreational standards usually focus on indicator bacteria, which are used to detect the level of fecal contamination in the water. E.Coli is considered a better indicator of human sewage than other types of bacteria because they are found in intestines of warm blooded animals. E. coli is the type of bacteria that local health authorities look for in freshwater. Primary contact with water containing high levels of fecal bacteria and other pollutants can lead to disease, infection, and rashes.
The Catawba Riverkeeper performs weekly E. coli tests at on 5 major lakes on the Catawba Chain. Lake James is included in this program and results are currently available for 8 beaches on our lake. Results are published in a national database called Swim Guide. To learn more about the Riverkeeper's program, visit https://www.catawbariverkeeper.org/swim-guide/
Program Results:
For historic data view our 2018 State of the Lake James Watershed Report
View our VWIN Chemical data for the last 24 years
View our latest Dissolved Oxygen results (choose DO/Temp/Secchi tab)
Get the latest VWIN Ranking Report
Turbidity Study
View LJEA's latest bacteria (E.coli) test results
Other Important Data:
Link to EQI's VWIN Water Quality Data Portal