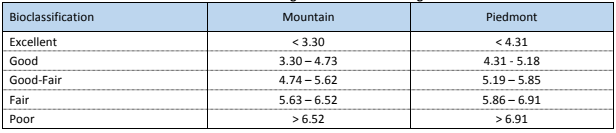
Macroinvertebrate Data and Biotic Index Scores
The following figures and maps present an overview of the macroinvertebrates collected at the 19 sample sites and the resulting Biotic Indices of stream health. All the sampled sites demonstrated good conditions; none of the macroinvertebrate communities showed any clear sign of biological impairment. The best sites, with Biotic Indices below 3.0, were: Mill Creek at Andrews Geyser and near Old Fort, Paddys Creek, Mackey Creek, Curtis Creek, Crooked Creek at McHone Road, and the Linville River upstream of NC 126. The two worst sites, the North Fork at Pitts Station Road and at Cannon Bridge, had Biotic Indices over 4.0 but less than 5.0. All other sites had Biotic Indices between 3 and 4.
Caution should be used in interpreting these results. Winter surveys often result in ‘best case’ conditions. Generally, streams in the winter are not stressed because of low dissolved oxygen or high-water temperatures and therefore intolerant taxa can dominate. LJEA intends to repeat the surveys the fall of 2018, during ‘poorer’ conditions, to note differences in the fauna and to assess sources of pollution.
Indicators of stream health include abundance of a given group of taxa (known as the EPT group) and the number of taxa observed that are known to be very pollutant intolerant (Biotic Index < 2.5) The following charts illustrates those measures as found at the Catawba River sample sites during the LJEA assessment. Figures 1 and 2 give an indication of the relative water and habitat quality between the assessment sites. In both figures, the higher the bar at a site, the stronger the indication of good water and habitat. However, care should be taken in comparing these data to assessments performed in other regions of the State or during other seasons.
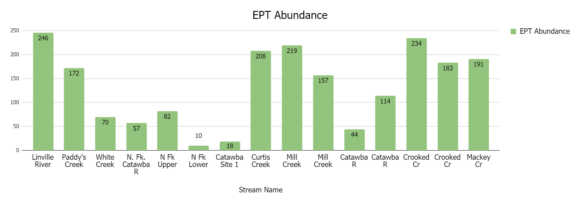
Fig. 1 Displays the total count of Mayflies, Stoneflies, and Caddisflies collected at each site.
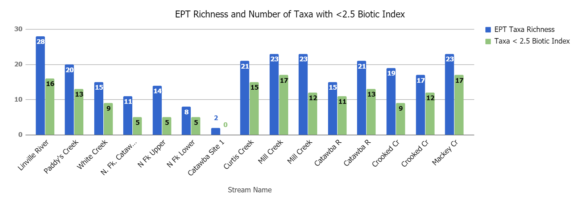
Fig. 2 Blue represents the number of different types of May, Stone, and Caddisflies. Green displays the number of different kinds of May, Stone, and Caddisflies that are especially sensitive to pollution.
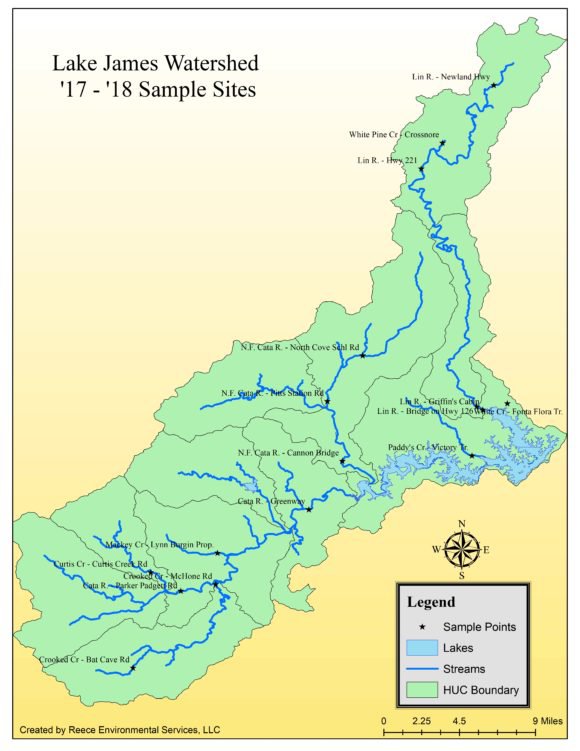
A spreadsheet with the sampled macroinvertebrate data and Biotic Indices (updated to include most recent data) is located here. The Appalachian State University team prepared a report on the Linville River Watershed that is located here. Click on the map below for the Biotic Index Values of each site.
A note on Crooked Creek: In addition to the biological survey, a special chemical monitoring study was performed on Crooked Creek by a student at Warren Wilson College under the supervision of Dr. Mark Brenner. The report can be found here.