River and Lake Sediment and Turbidity Monitoring in the Lake James Watershed
LJEA volunteers, in cooperation with the Volunteer Water Information Network (VWIN) and the Environmental Quality Institute (EQI), have been monitoring the sediment and turbidity in the Catawba River, North Fork Catawba River, Linville River, and Lake James since 2002. Samples are taken monthly and laboratory analysis is used to quantify the Total Suspended Solids (TSS) and the Turbidity of each sample. The samples are taken at one location on each of the major rivers (Catawba River, North Fork Catawba River, Linville River). Over the past five years, that monitoring has indicated that we have levels of sediment and turbidity that are similar to streams across western North Carolina. The following figures presented as whisker plots (Want to understand how to read this box and whisker plot? Click here.) show the range and mean of TSS and Turbidity and the percentage of samples in the rivers that have turbidity exceeding 10 NTU and 50 NTU.
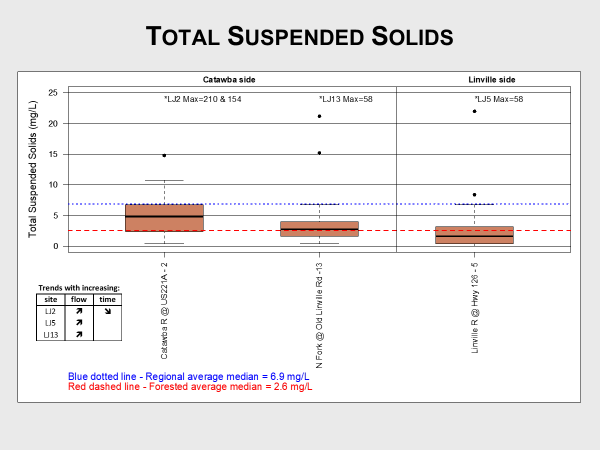
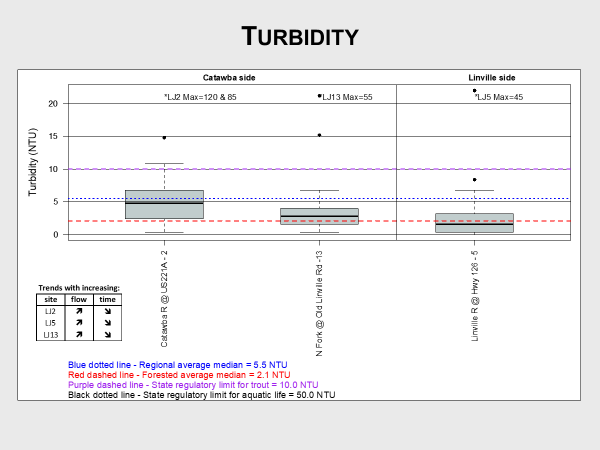
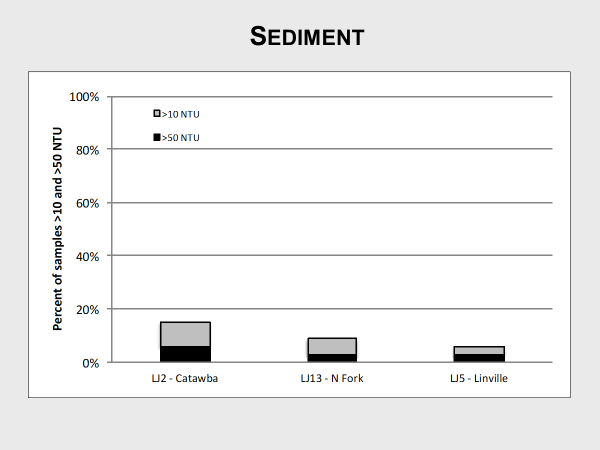
The observations of Turbidity in the rivers illustrate that the river water was “clear” at all the observation sites in over 85% of the observations and that the water was “turbid” (> 50 NTUs, which is considered to be harmful to aquatic life if exposed to those conditions long-term) in less than 5% of the observations. Because soil particles settle out when they enter still or slowly flowing water, we expect the observations in the lake to be lower in both TSS and sediment-caused Turbidity than what we typically observe in streams.
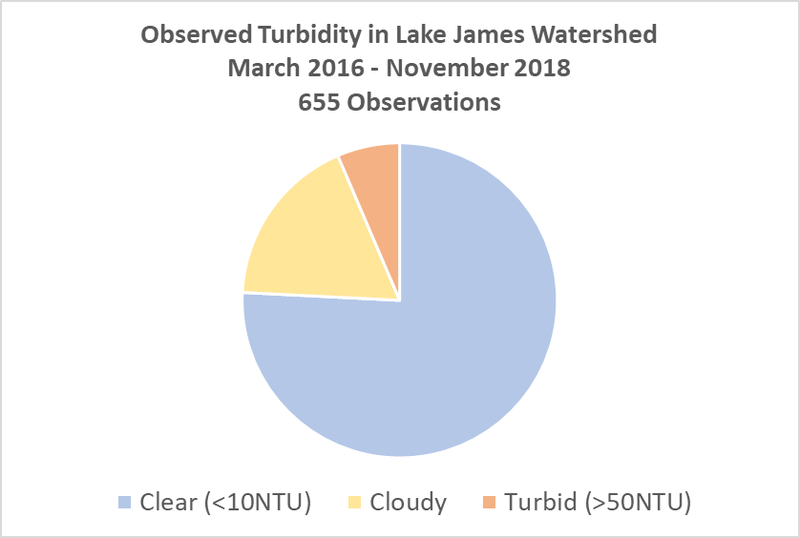
In 2016, LJEA decided to expand its turbidity monitoring effort. Additional observation stations were added on the Catawba River, Crooked Creek, North Fork Catawba River, and Linville River and observations were made on both a regular schedule and during wet weather events. Between March 2016 and November 2018, LJEA has used Secchi tubes to record 655 turbidity observations. Approximately 76% of samples were “clear” (<10 NTU), 18% had enough sediment so that they were not healthy over the long term for sensitive species such as trout (between 10 and 50 NTU), and 6% of the samples were “turbid” and unhealthy for most aquatic species if they were exposed to that level over a long period (>50 NTU). All the turbidity observations can be examined on the LJEA website.
There have been limited observations of TSS and Turbidity conducted by the NC Department of Natural Resources (now Department of Environmental Quality), the US Environmental Protection Agency, and other cooperating agencies over the past 40 years. That data is available here.