Nutrients
Nutrients (Orthophosphate, Nitrate/Nitrite Nitrogen, and Ammonia Nitrogen)
Orthophosphate
Orthophosphate is the dissolved phosphorus in water that is readily available for consumption by plants and algae. Phosphorous is a limiting nutrient for plant life in a water system. This restricts the growth and spread of aquatic plants and algae to within normal levels. If too much phosphorus becomes available to plants in the form of orthophosphate, it can be consumed immediately, leading to rapid and unrestricted growth. This can lead to abnormally high rates of algal growth which result in periodic algal blooms in reservoirs and lakes. The overabundance of nutrients resulting in blooms is called eutrophication. Some sources of phosphorus include disturbed land, wastewater treatment plants, failing septic systems, runoff from fertilized crops and lawns, and livestock waste storage areas. There is no legal water quality standard, but phosphorus levels are ideal below 0.05 mg/L. Orthophosphate levels are considered ideal below 0.15 mg/L to prevent eutrophication. The VWIN regional average for orthophosphate is 0.10 mg/L, and the pristine (heavily forested) average is 0.04 mg/L.
The chart below (figure 1) is a box and whisker plot comparing the Orthophosphate concentrations for three years (2015-2017) at each of our monitoring sites to the regional and forested averages. Observations are well below the ideal 0.15 mg/L level, the 0.10 mg/L regional average level, and in some cases below the forested average median of 0.04 mg/L. The one exception is the concentration level in the North Fork of the Catawba River.
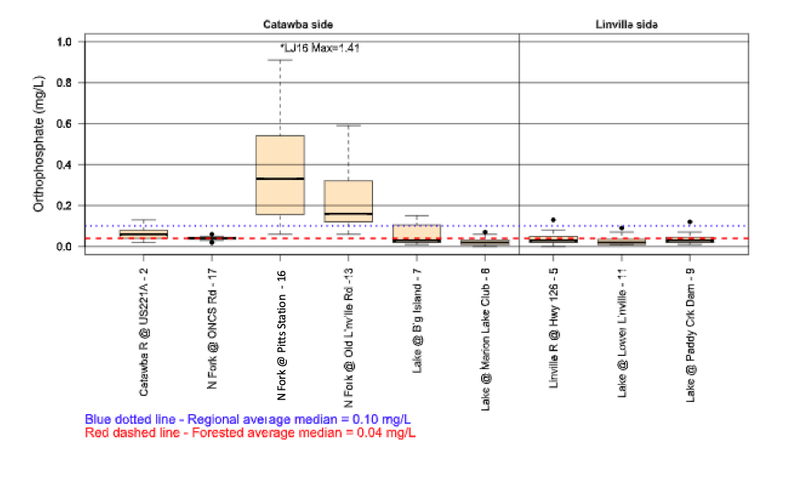
Figure 1. – Whisker plot of Orthophosphate readings vs regional median and forested median 2015 – 2017 (Source: EQI) (want to understand how to read this box and whisker plot? Click here.)
Beginning in February 2017, Lake James Environmental Association began monitoring the North Fork River more closely to try to pinpoint where the rise in Orthophosphate levels is coming from. In the graph below in (Figure 2) you will see the results of our testing on the North Fork at three locations (North Cove School, Pitts Station Rd, and at Old Linville Road – Click here to see a map of these locations ). While the Orthophosphate levels do not exceed any legal or regulatory thresholds, the levels at Pitts Station Road and Old Linville Road are higher than concentrations normally observed in the streams in the VWIN program. It is important to note that these levels have declined in 2018, possibly due to changes that are being made by industries upstream.
In a mostly positive chemical assessment of the lake, this is the most concerning indicator that we are tracking. LJEA will continue to monitor Orthophosphate levels and work with our community upstream to ensure our watershed is protected.
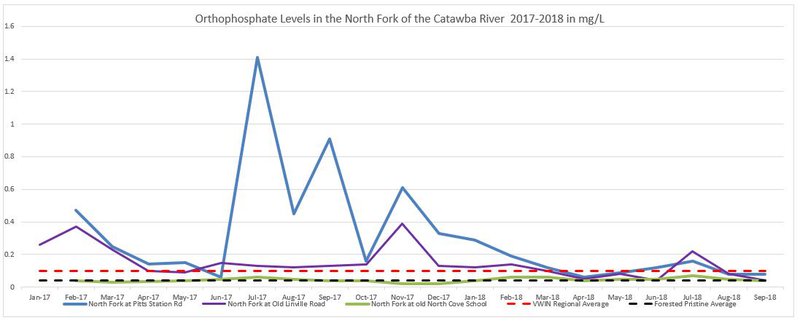
Figure 2. 2017-2018 Orthophosphate levels in the North Fork River
Trending of average readings in the lake and each of the rivers over the last 18 years (in figure 3) shows Orthophosphate levels within VWIN area norms consistently with the exception of the North Fork of the Catawba River.
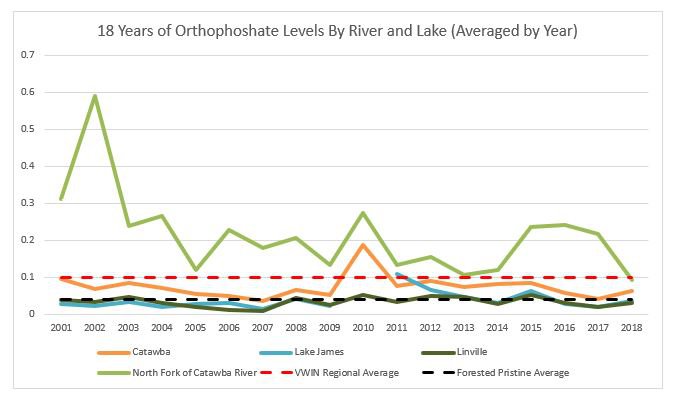
Figure 3. – Last 18 years Orthophosphate levels by year
Nitrate/Nitrite
Nitrogen is another nutrient that can contribute to excessive stream and lake algal growth. High concentrations of Nitrogen in the form of nitrate is extremely toxic to infants and the unborn when ingested. It can prevent oxygen transfer in the blood stream at high doses. This is why the national drinking water standard is less than 10 mg/L. The most likely sources for higher nitrate levels in water are septic drainage and fertilizer runoff from agricultural land and domestic lawns. Nitrates from land sources wind up in streams more rapidly than other nutrients such as phosphorus because they are easily dissolved in water, and can therefore readily travel with surface runoff and groundwater into streams. As a result, nitrates are a useful indicator of sources of pollution from animal waste and/or sewage during dry weather. The VWIN regional average for nitrate/nitrite nitrogen is 0.4 mg/L, and the pristine average is 0.2 mg/L.
The chart below (figure 4) is a box and whisker plot comparing the Nitrate/Nitrite concentrations for three years (2015-2017) at key LJEA VWIN monitoring sites to the regional and forested averages. Observed concentrations are well below the 10 mg/L level, the 0.4 mg/L regional average level and in most cases below the forested average median of 0.2 mg/L.
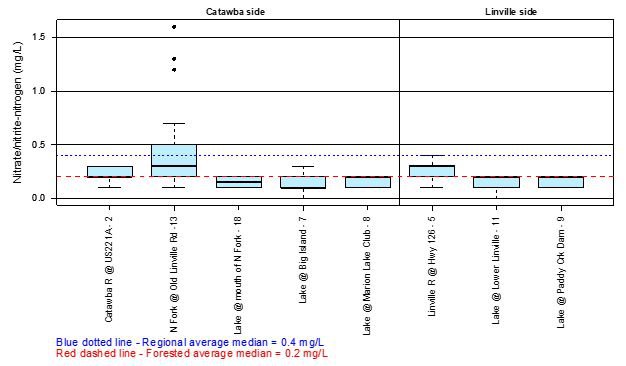
Figure 4 – 2015-2017 Nitrate/Nitrite nitrogen concentrations at each monitoring site compared to the VWIN regional average median for WNC streams and to the median for stream sites in largely forested areas. (Source: EQI) (want to understand how to read this box and whisker plot? Click here.)
Trending of average readings in the lake and each of the rivers over the last 18 years (in figure 5) shows Nitrate/Nitrite Nitrogen levels within VWIN area norms with overall improving trends in all of the rivers.
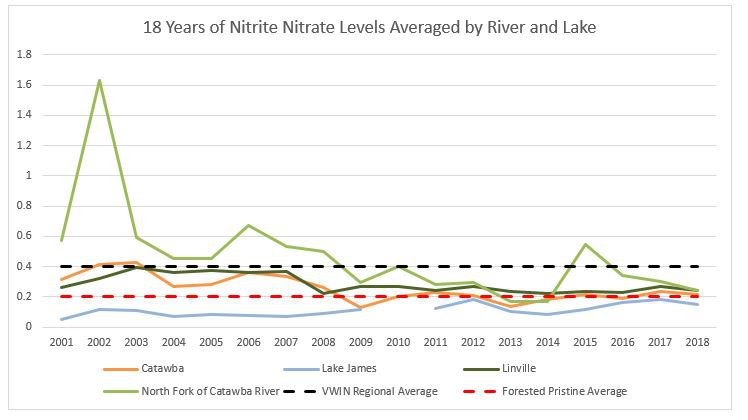
Figure 5. – Last 18 years Nitrite Nitrate levels by year
Ammonia Nitrogen
This form of nitrogen is created by the decomposition of dead plants and animals. Elevated levels of ammonia can be toxic to fish and other aquatic life. Likely sources of ammonia nitrogen are agricultural runoff, livestock farming, septic drainage, and discharge from sewage treatment plants. Streams with extensive trout farming may also show increased levels of ammonia due to the decomposition of fish waste. The proposed standard to protect trout waters is 1.0 mg/L in the summer and 2.0 mg/L in the winter. The VWIN regional average is 0.08 mg/L, and the pristine average is 0.04 mg/L.
The chart below (figure 6) is a box and whisker plot comparing the Ammonia Nitrogen concentrations for three years (2015-2017) at key LJEA VWIN monitoring sites to the regional and forested averages. Observed concentrations are well below the 1.0 mg/L level required for trout waters, the.08 regional average level and slightly higher than the .04 mg/L forested area average.
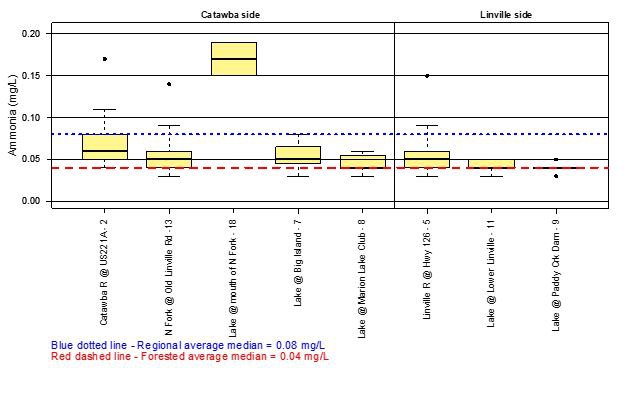
Figure 6. 2015-2017 Ammonia Nitrogen concentrations at each monitoring site compared to the VWIN regional average median for WNC streams and to the median for stream sites in largely forested areas (Source: EQI) (want to understand how to read this box and whisker plot? Click here.)
Trending of average readings in the lake and each of the rivers over the last 18 years (in figure 7) shows Ammonia Nitrogen levels improving and staying within area norms over the observed period.
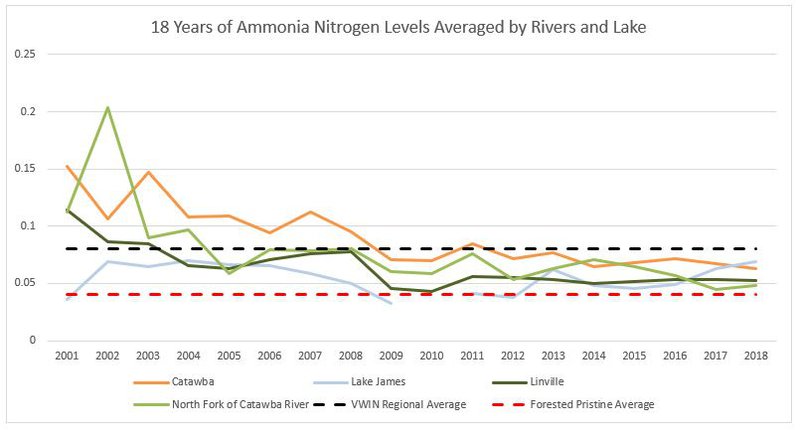
Figure 7. – Last 18 years Ammonia Nitrogen levels by year