Acidity/Alkalinity
Acidity in a solution, such as water, is measured by using the 14 digit pH scale. (See Figure 11 for a graphic illustration of the scale)
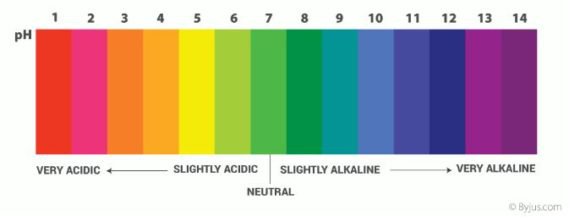
Figure 11
The naturally occurring pH in local streams should range between 6.5 – 7.2. Values less than 6.5 may suggest some source of acid influencing the pH of the stream. An example of an acidic source is acid rain, in which the water of the raindrops have an acidic (less than 7) pH. As the rain flows into the the streams, it affects the overall pH level of the water. The same is true with anything affecting the pH of the water towards the alkaline side of the pH scale. Any value above 7.5 may be due to industrial discharge. The VWIN regional average for pH is 7.1 with the pristine average being 6.9.
These pH values are important because organisms living in our streams and lakes have adapted to the naturally occurring pH level associated with their habitat. Any changes to the pH, even small fluctuations, whether acidic or alkaline, can highly impact the reproductive habits of these organisms and even eliminate them altogether. Therefore, pH is an important indicator of water quality because it can seriously impact and impair the aquatic ecosystem. It also plays an important role in controlling the solubility of certain toxic contaminants, such as metals in the water system.
The chart below (figure 12) is a box and whisker plot comparing the PH levels for three years (2015-2017) at key LJEA VWIN river monitoring sites to the regional and forested averages. Observations in the Catawba and Linville rivers fall just around the regional averages. However, the North Fork of the Catawba river is approaching the value above 7.5 which may be an indicator of industrial discharge. This falls in line with discussions above around Orthophosphate and Conductivity levels.
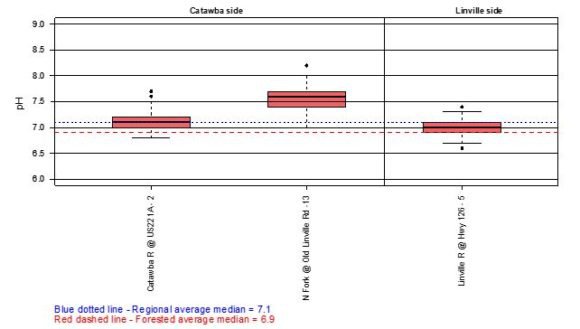
Figure 12. pH levels at each stream monitoring site compared to the VWIN regional average median for WNC and to the median for sites in largely undisturbed areas (Source: EQI) (want to understand how to read this box and whisker plot? Click here.)
Trending of average readings in the lake and each of the rivers over the last 18 years (in figure 13) shows PH levels trending slightly above VWIN area norms in the Catawba River and within area norms in the Linville River. The North Fork of the Catawba River consistently trends somewhat higher.
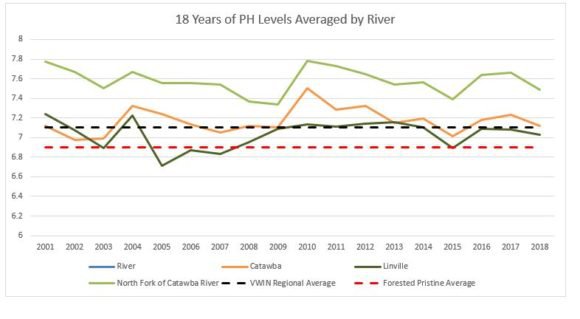
Figure 13. – Last 18 years PH levels by year
Alkalinity is used as a measurement to determine the acid neutralizing capability of water or soil. Water systems with a high alkalinity measurement are considered to be well buffered against acidic inputs into the system. Water bodies that are supplied with this buffer are able to neutralize any sources of acidic inputs, such as acid rain, decomposing organic matter, and industrial discharge. This alkaline buffer is often naturally occuring in a stream due to water runoff that has obtained a more alkaline pH from leaching across basic limestone soils or bedrock before flowing into the stream. A positive outcome of this leaching is that the pH levels in a water source are held relatively constant despite acidic inputs into the system. However, excessive acidic input can overwhelm the alkaline buffer resulting in the previously mentioned acidic pH changes to the stream. We can anticipate acidification issues in our streams by measuring the associated alkalinity. Although there is no legal standard for alkalinity in water, measurements below 30 mg/L are considered low alkalinity. Streams in our region tend to have very low alkalinity due to the thinner soils, and because the underlying granitic bedrock does not contain many acid-neutralizing compounds. The VWIN regional average is 22.4 mg/L, and the pristine average is 8.4 mg/L.
The chart below (figure 14) is a box and whisker plot comparing the Alkalinity levels for three years (2015-2017) at key LJEA VWIN river monitoring sites to the regional and forested averages. Observed alkalinity levels fall within the range as expected for this area for the Catawba and Linville rivers. The alkalinity of the North Fork is higher than regional averages, but that is not necessarily a negative indicator.
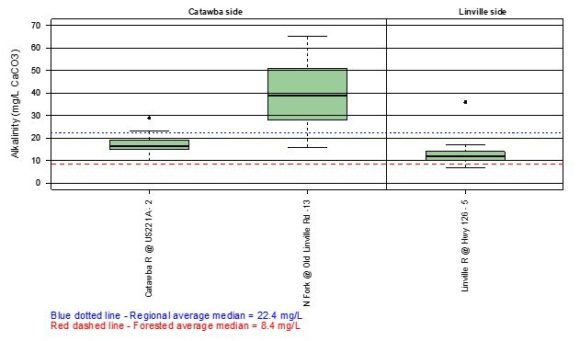
Figure 14. Alkalinity levels at each stream monitoring site compared to the VWIN regional average median for WNC and to the median for sites in largely undisturbed areas (Source: EQI) (want to understand how to read this box and whisker plot? Click here.)
Trending of average readings in the lake and each of the rivers over the last 18 years (in figure 15) shows Alkalinity levels trending slightly above VWIN area norms. The North Fork of the Catawba River consistently trends somewhat higher.
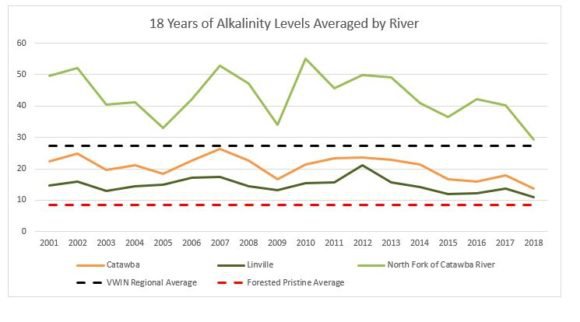
Figure 15. – Last 18 years Alkalinity levels by year