Conductivity
Conductivity is a measure of the ability of water to conduct an electrical current. Pure water will not conduct an electrical current, but water containing dissolved solids and salts will form charged ions that are conductive. The concentration of these ions in water determine its conductivity. These ions may include dissolved solids such as nitrate, phosphate, sodium, iron, and others. Streams, like many in the Lake James watershed, whose beds are composed of bedrock, particularly granitic bedrock, and coarse gravel have naturally low levels of conductivity. Conductivity is measured in micromhos per centimeter (μmhos/cm). The VWIN regional average is 72.1 μmhos/cm, and the pristine average is 18.7 μmhos/cm. Higher levels of conductivity could be an indicator of pollutants making their way into our streams.
The chart below (figure 8) is a box and whisker plot comparing the conductivity levels for three years (2015-2017) at key LJEA VWIN river monitoring sites to the regional and forested average. Observed conductivity levels are well below the 72.1 μmhos/cm regional average in the Catawba and Linville Rivers. However, the North Fork of the Catawba River averages above 125 μmhos/cm.
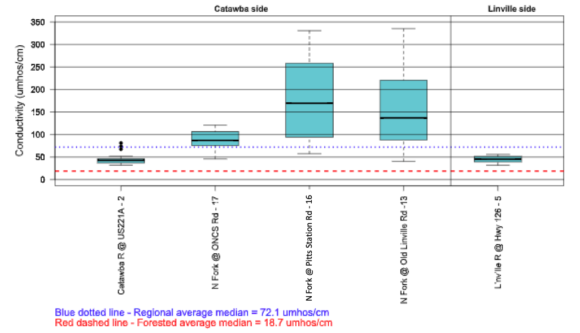
figure 8. 2015-2017 Conductivity levels at each stream monitoring site compared to the VWIN regional average median for WNC and to the median for sites in largely forested area (Source: EQI) (want to understand how to read this box and whisker plot? Click here.)
The conductivity level in the North Fork by itself is by no means a cause for alarm as streams in the US can have conductivity levels anywhere up to 1500 μmhos/cm. However, the higher conductivity in the North Fork compared to regional averages, taken along with other indicators (particularly Orthophosphates), is a good reason to focus more on the North Fork. In the graph below (Figure 9) you will see the results of our 2017-2018 testing on all of our rivers including a break out of the North Fork at three locations (North Cove School Rd, Pitts Station Rd, and at Old Linville Road – Click here for a map of these locations). Interestingly, the conductivity level charts very similarly to the trends observed in the Orthophosphates section above. This is another reason that LJEA will continue to closely monitor the North Fork of the Catawba river, and work to eliminate potential pollutants in the future.
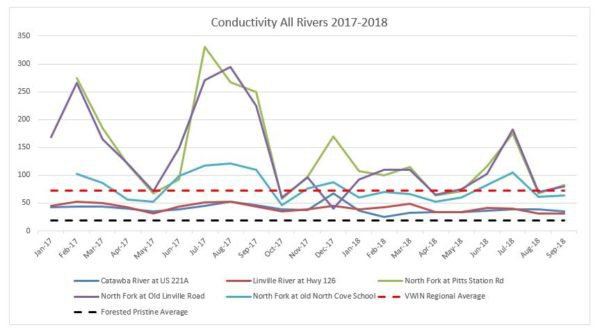
figure 9. 2017-2018 Conductivity levels in our rivers
Trending of average readings in the lake and each of the rivers over the last 18 years (in figure 10) show Conductivity levels within VWIN area norms consistently, with the exception of the North Fork of the Catawba River.
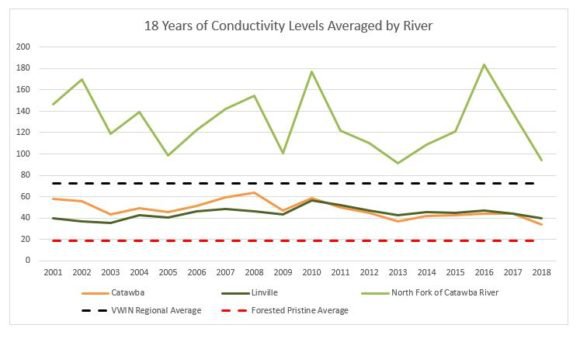
Figure 10. – Last 18 years Conductivity levels by year