Land Cover changes in the riparian zone for each Hydrologic Unit
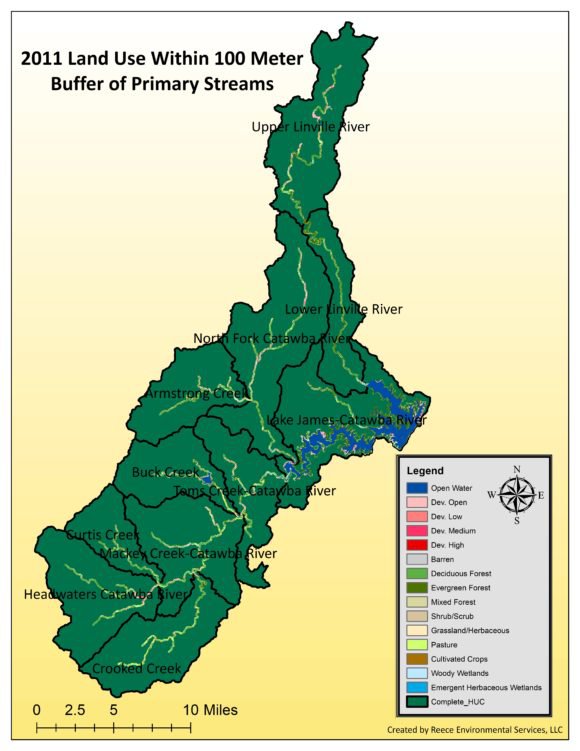
The Land Use and Land Cover near streams, rivers and lakes has a more direct impact upon water quality than in more upland areas. The 2018 Land Cover analysis performed for LJEA used the National Land Cover Database for 2001 and 2011. The land cover was tabulated for the riparian zones within 100 meters of open water in the major streams, rivers and lakes of each of the Hydrologic Units (HU) that comprise the Lake James Watershed. A map showing those HUs is here. The National Land Cover Database assigns one of fifteen different land cover classifications to every 30 meter by 30 meter area within the watershed for each of the two years. The land cover classifications and the tabulations for the riparian zones in each HU are presented in this spreadsheet.
To aid the reader in quickly understanding the data, the following discussion groups the 15 classifications as follows:
- Developed consists of Developed Open Space, Low Intensity Development, Medium Intensity Development, High Intensity Development and Barren (usually rock, sand, pavement and other hard surfaces).
- Forest consists of Deciduous Forest, Evergreen Forest and Mixed Forest.
- Agriculture, Grassland & Shrub consists of Shrub/Scrub, Grassland/Herbaceous, Pasture and Cultivated Crops.
- Other consists of Woody Wetlands and Emergent Herbaceous Wetlands.
The riparian zones in the Lake James Watershed are generally more highly impacted by development and agriculture than is the overall watershed. Only two of the HUs have Developed area in the Riparian Zones less than 8% (Crooked Creek and Lower Linville). Five of the HUs have Developed area exceeding 15% (Catawba Headwaters, Buck Creek, Armstrong Creek, North Fork and the Upper Linville). As of 2011, Development in the riparian zones of the Upper Linville were nearly 22%. It is likely that percentage is now higher and that both the Catawba Headwaters and North Fork HUs exceed 20% Development in their riparian zones.
Agriculture, Grassland & Shrub make up nearly 32% of the riparian zone in Crooked Creek. That classification comprises more than 10% of seven of the HUs (Crooked Creek, Catawba Headwaters, Mackey Creek, Buck Creek, Tom’s Creek, North Fork and Upper Linville). On the positive side, only Mackey Creek and Tom’s Creek have Forest cover on less than 60% of their riparian zones.
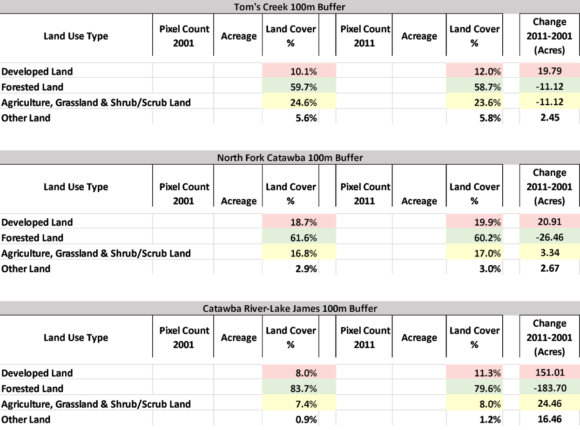
The changes between 2001 and 2011 in the riparian zones were small in all but three HUs (Tom’s Creek, North Fork and Catawba/Lake James). The land cover for those HUs are shown below. In those three HUs the changes were, on net, adverse to water quality.
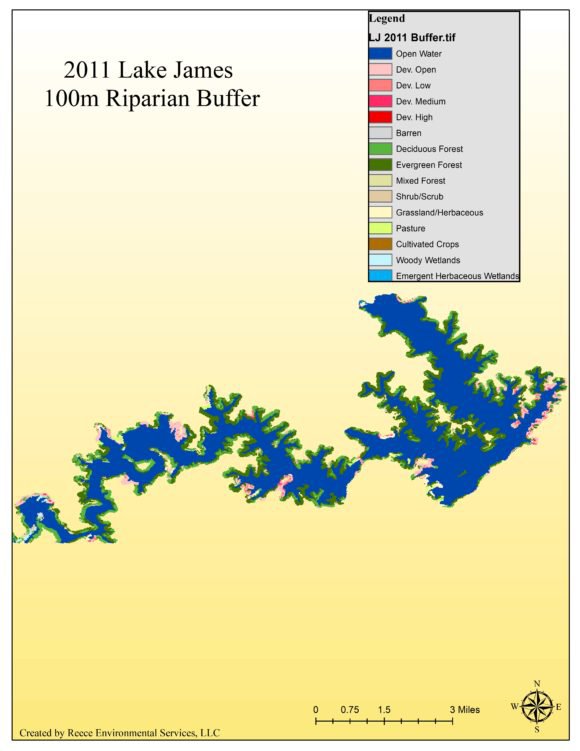
The land cover in the riparian zones in 2001 and 2011 are shown on the maps below.