Land Cover Analysis
Summary
In the absence of significant point source discharges, the quality of the water in rivers and streams generally reflects the land use and land cover within the watershed. While specific local conditions must be considered, watersheds where the land cover is predominantly forest generally have good water quality. Water quality degradation may occur where deforestation has occurred, or there is intensive agricultural activity or development. Studies have shown that significant declines in water quality can be observed when the developed land within a watershed approaches 25% or when the impervious area within a watershed exceeds 10% (see http://www.wncstormwater.org/issues.html). In addition, because development usually increases the volume and velocity of storm runoff, increased erosion of upland areas and the stream banks and bed often occur. The trends in land use and land cover over a period of years are often a good predictor of the changes and future quality of a watershed’s streams and rivers.
In the spring of 2018, the Lake James Environmental Association, in cooperation with UNC-Asheville, supported a student research project to quantify the land cover in the Lake James Watershed and examine how it had changed over a 10-year period. Using data from the National Land Cover Database, maps were prepared for the Hydrologic Units (subwatersheds) within the Lake James Watershed and land cover in each Hydrologic Unit was tabulated for the years 2001 and 2011. See a map of the Lake James Hydrologic Units (HUs) here. A fact sheet describing the National Land Cover Database is here. LJEA expects to update the land cover analysis when new, comparable data becomes available (expected by the spring of 2019).
Observations of Land Cover in the Lake James Watershed
Many of the headwaters of Lake James originate in Pisgah National Forest and other public lands. These are predominantly forested areas, and the fact that they are protected from development and major land disturbance benefits water quality in the Lake James Watershed. In 2011, approximately 83.3% of the watershed was “Forest,” about 1% less than in 2001, representing a loss of 2784 acres of forest. Approximately 7.8% of the watershed was classified as “Developed” in 2011, an increase of over 560 acres from 2001. Across the watershed, there was little net change in cultivated land (a net change of -23 acres) but a 300 acre decrease in land classified as “Pasture.” The net changes in land cover over the entire watershed are shown in the table below and are tabulated in detail here.
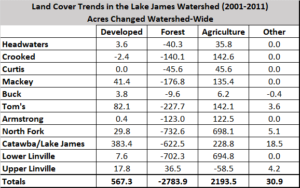
The watershed, in aggregate, is well below the level of development and impervious surface that is generally associated with significant water quality degradation. The LJEA analysis indicates that the trend between 2001 and 2011 was adverse to water quality, but the changes were generally small. The largest changes, both adverse to water quality, occured in the Tom’s Creek and Catawba/Lake James hydrologic units. Those areas and other portions of the watershed of concern are discussed in the main body of this report. It is important that LJEA updates this analysis when the 2016 National Land Cover Database is available for the area.
What about the Riparian Zones?
Water quality is more directly impacted by land use and land cover in the riparian zone along the streams, rivers and lakes than it is by more upland areas. Unfortunately, the Lake James Watershed experienced significant degradation in its riparian zones (land within 100 meters of a body of water, for this report’s purposes) between 2001 and 2011. There were 228 acres of forest lost and over 200 acres of newly developed land within the watershed’s riparian zones. The HUs with the most highly impacted riparian zones are: Catawba/Lake James, Tom’s Creek, Upper Linville, Crooked Creek and Mackey Creek. The net changes in land cover in the Lake James Watershed’s riparian zones is shown in the table below and is tabulated in detail here.
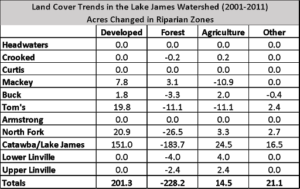
The majority of the riparian zone degradation occurred in the vicinity of Lake James. In that Hydrologic Unit (HU), the Developed land increased from 8.0% to 11.3% between 2001 and 2011 (over 150 acres of development in the riparian zone). Over 180 acres of forest was lost in this HU between 2001 and 2011. It is likely that the percentage of Developed land in the HU is now approaching, or has surpassed, 15%. The land cover changes in the watershed and its riparian zones, and tabulations of the changes experienced in each HU between 2001 and 2011 are discussed below. As previously noted, it is important that LJEA updates this analysis when the 2016 National Land Cover Database is available for the area.